23 august 2026 · düsseldorf
bain.monster
A dashboard over one private folder of notes, with a public page that publishes the real numbers under project names that do not exist.
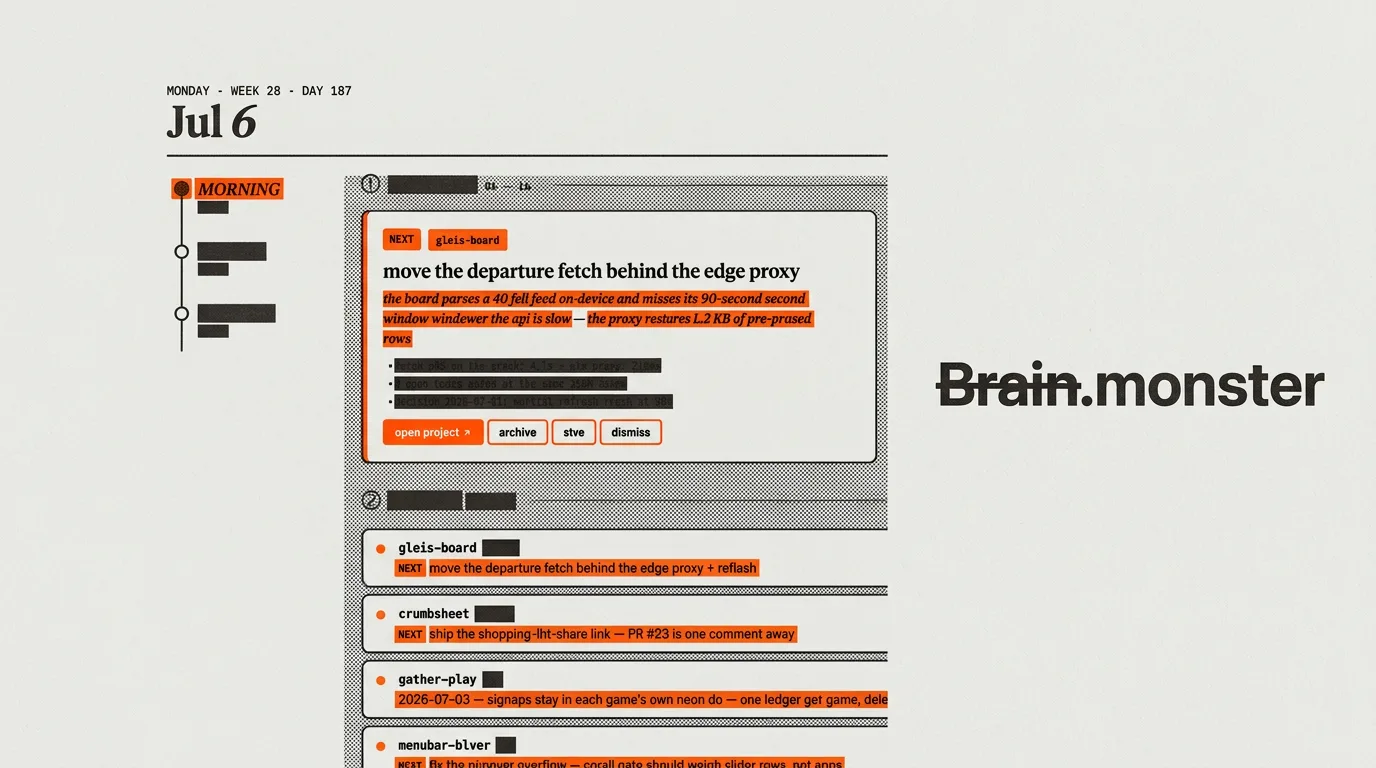
On 19 August every website I own went down for eleven hours. The thing that took them down was the dashboard I built to watch them. It runs on the same hosting account as the sites it checks, and it had burned through that account's free allowance of computing time.
The dashboard is bain.monster and it reads one private folder. Project notes, a journal file for each day, an inbox, a running list of every decision inside every project. Claude Code writes into that folder all day. The dashboard is how I read it back.
The sign-in page says it in one line. "One private markdown repo in, eleven live views out." The shorter version is that the folder is the database. Logging a thought and shutting a project down are the same move, one line changing in a file.
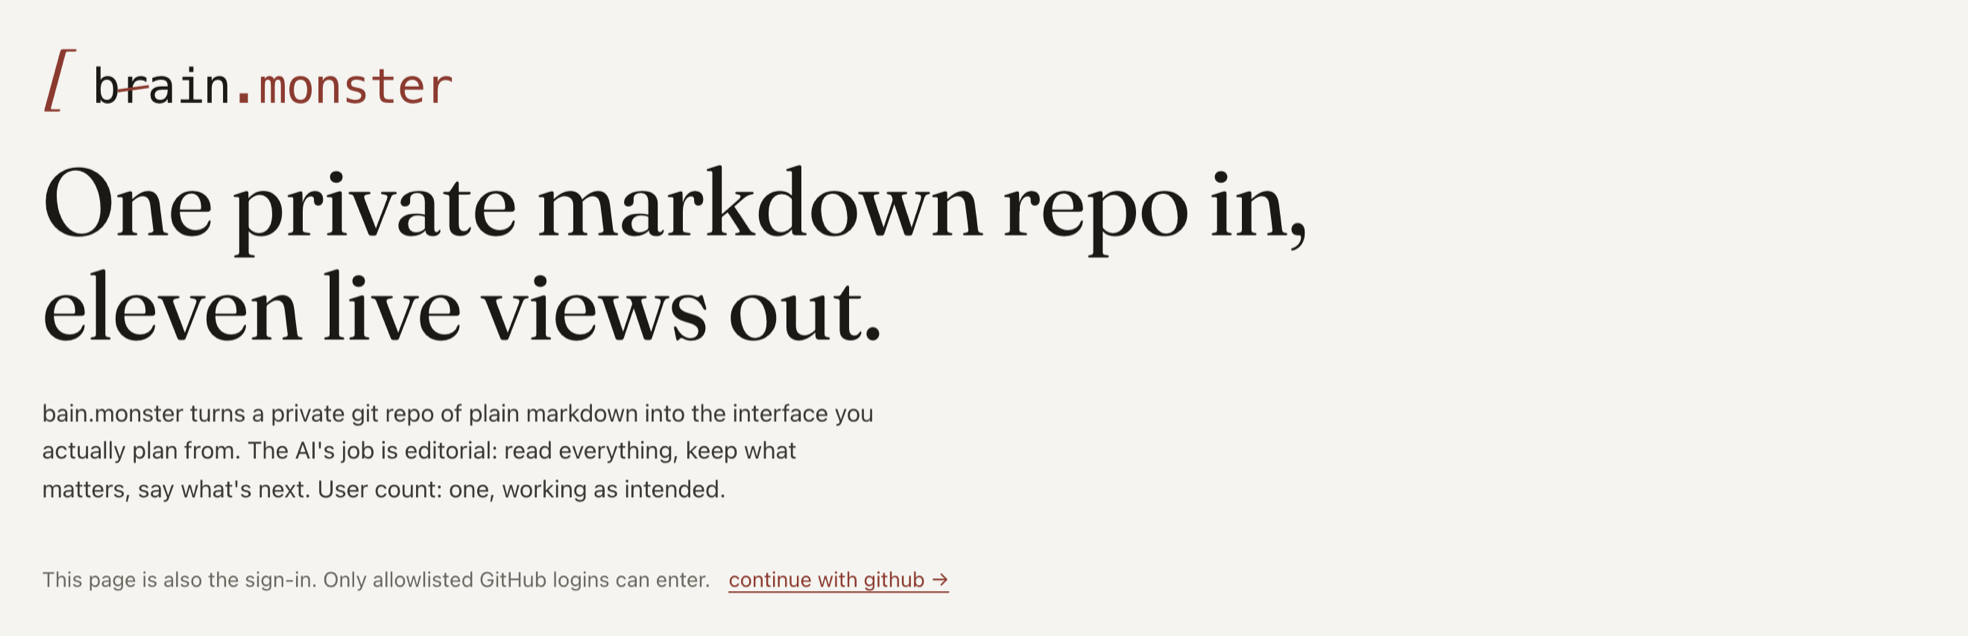
The brain viewer
It started on 18 April 2026 under the name DevDash. Twenty commits in forty-two minutes, one evening. A month later I rebuilt it as a viewer for the notes, with pages for Today, Projects, Inbox and Insights.
Then a diagnosis I had not expected. The dashboard looked like it only knew about recent projects, and the cause was in the notes rather than the code. Most of the project files carried a status other than active. I built a status manager into the projects page and left the rest of the app alone, because the data was the thing that was wrong.
On 20 May it moved to bain.monster, and got a wordmark that animates brain.monster into bain.monster by striking out the r.
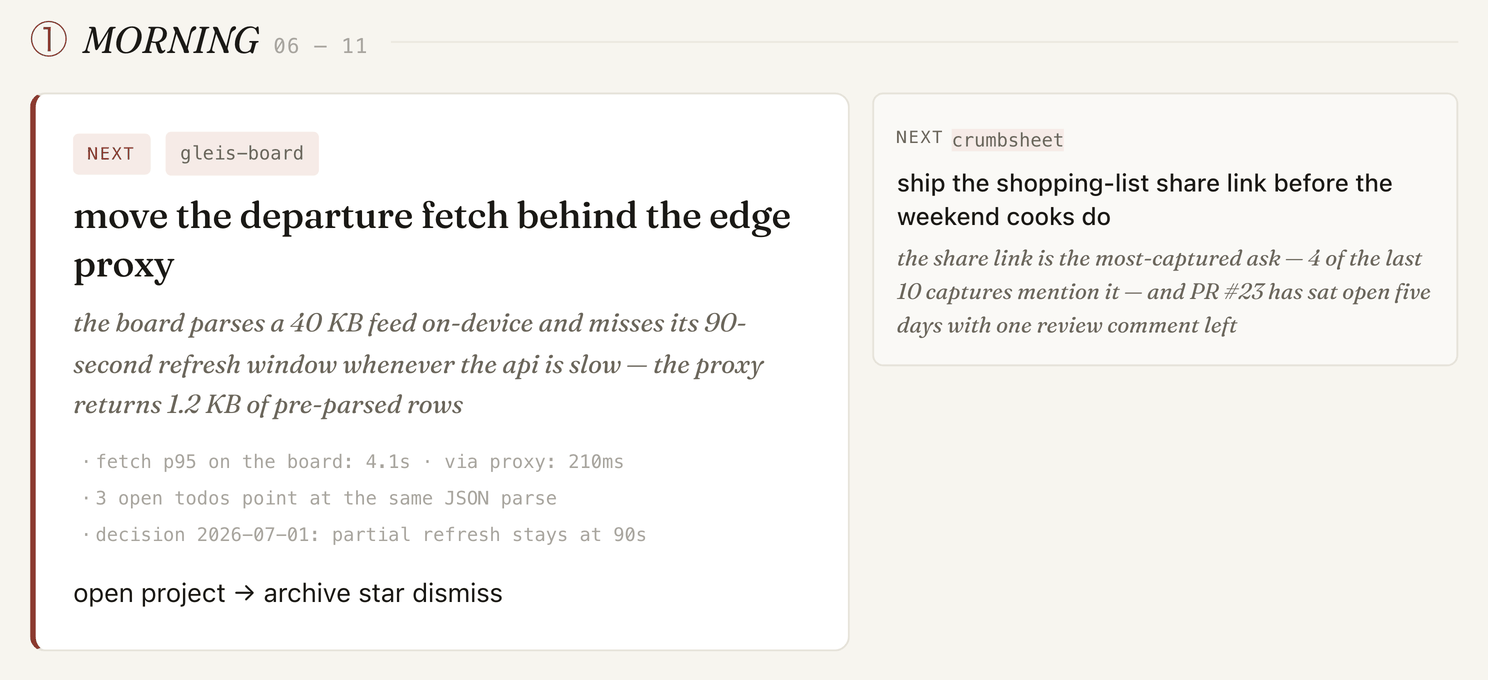
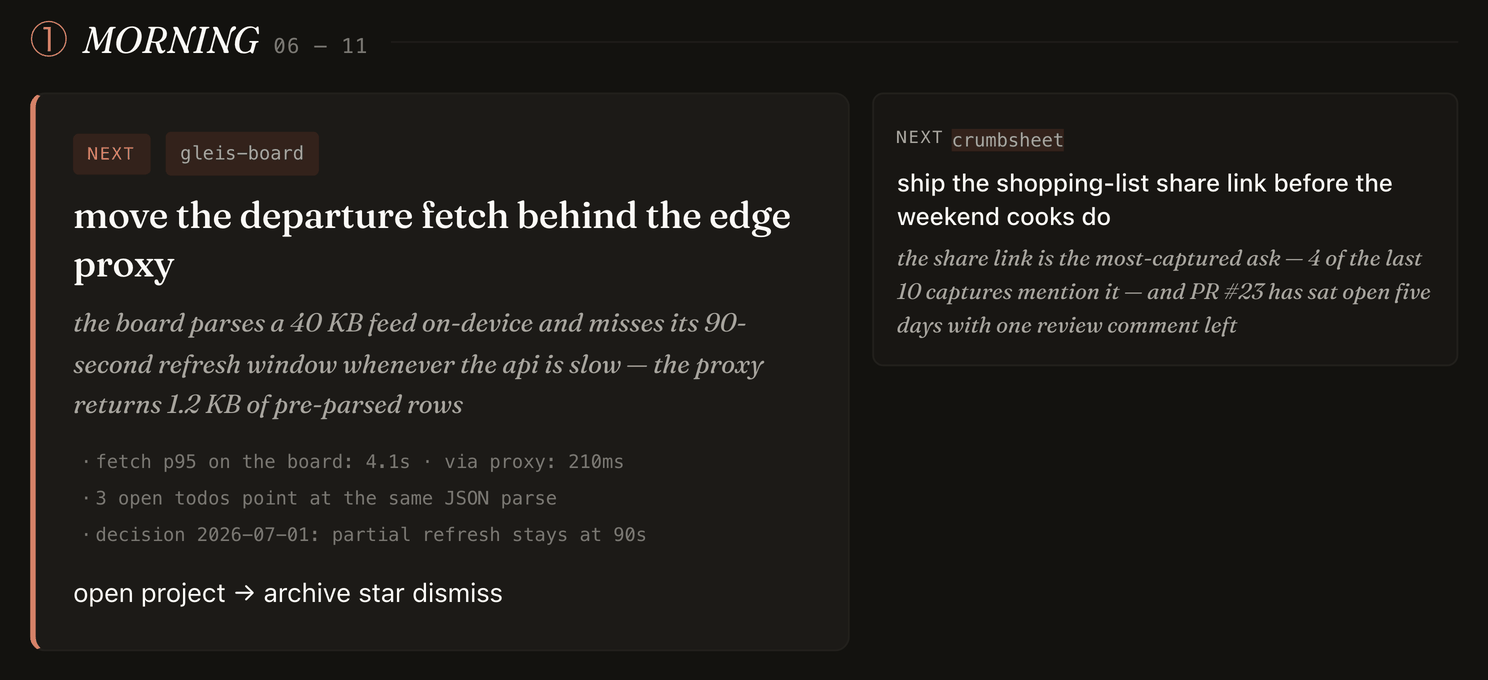
Twice a day a model reads the last week of journals and the projects still running, and writes one summary the pages read back. A second routine, running on Opus, ranks what I should do next.
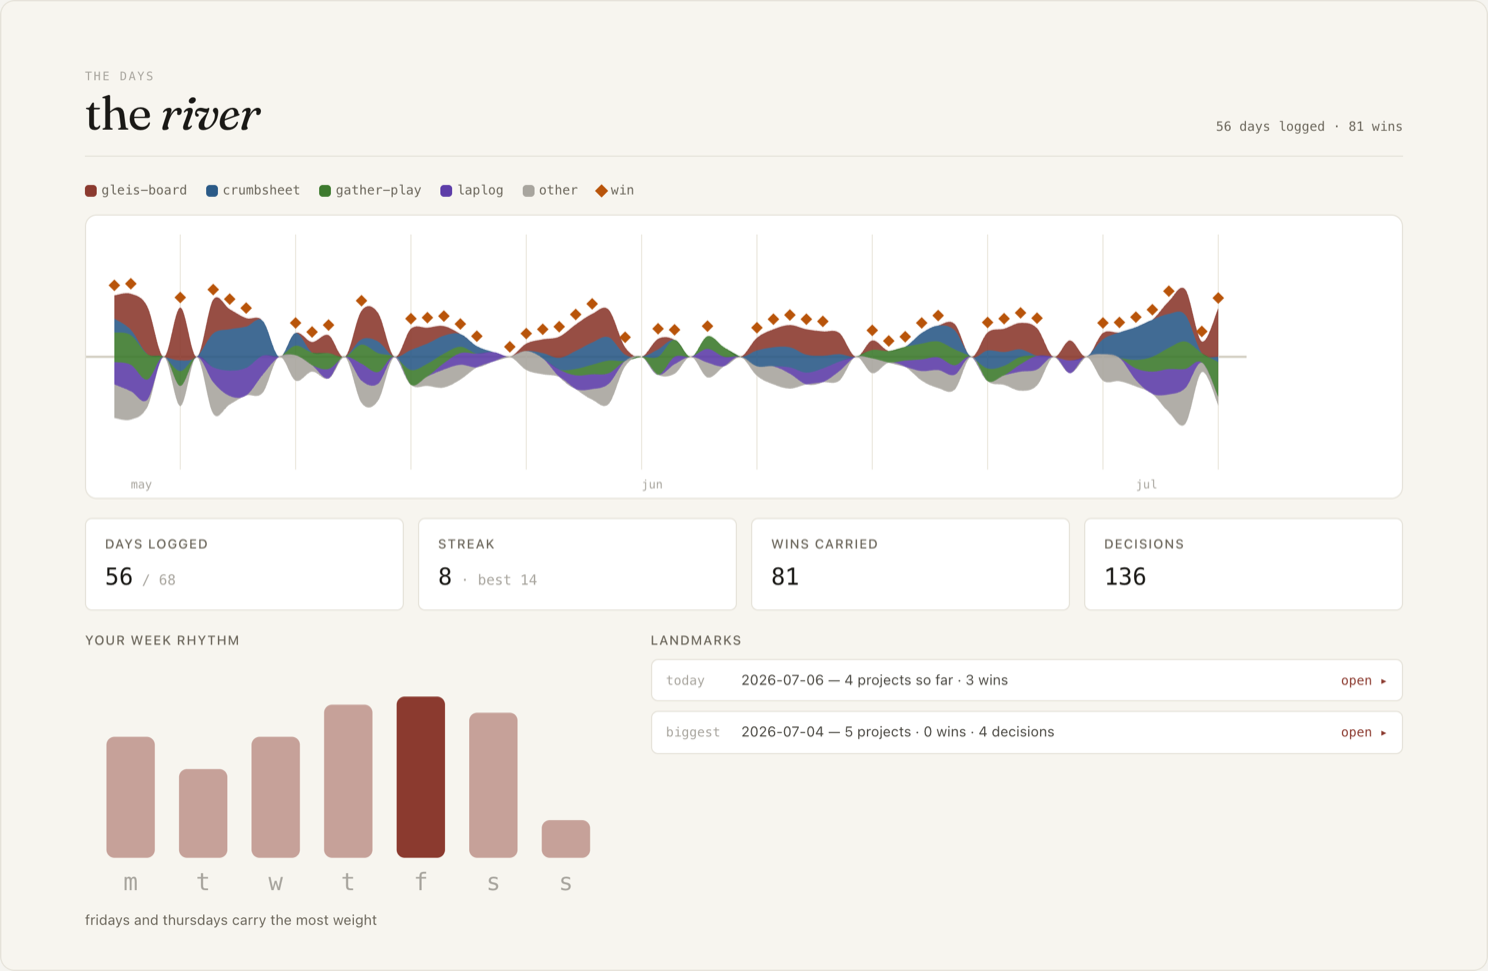
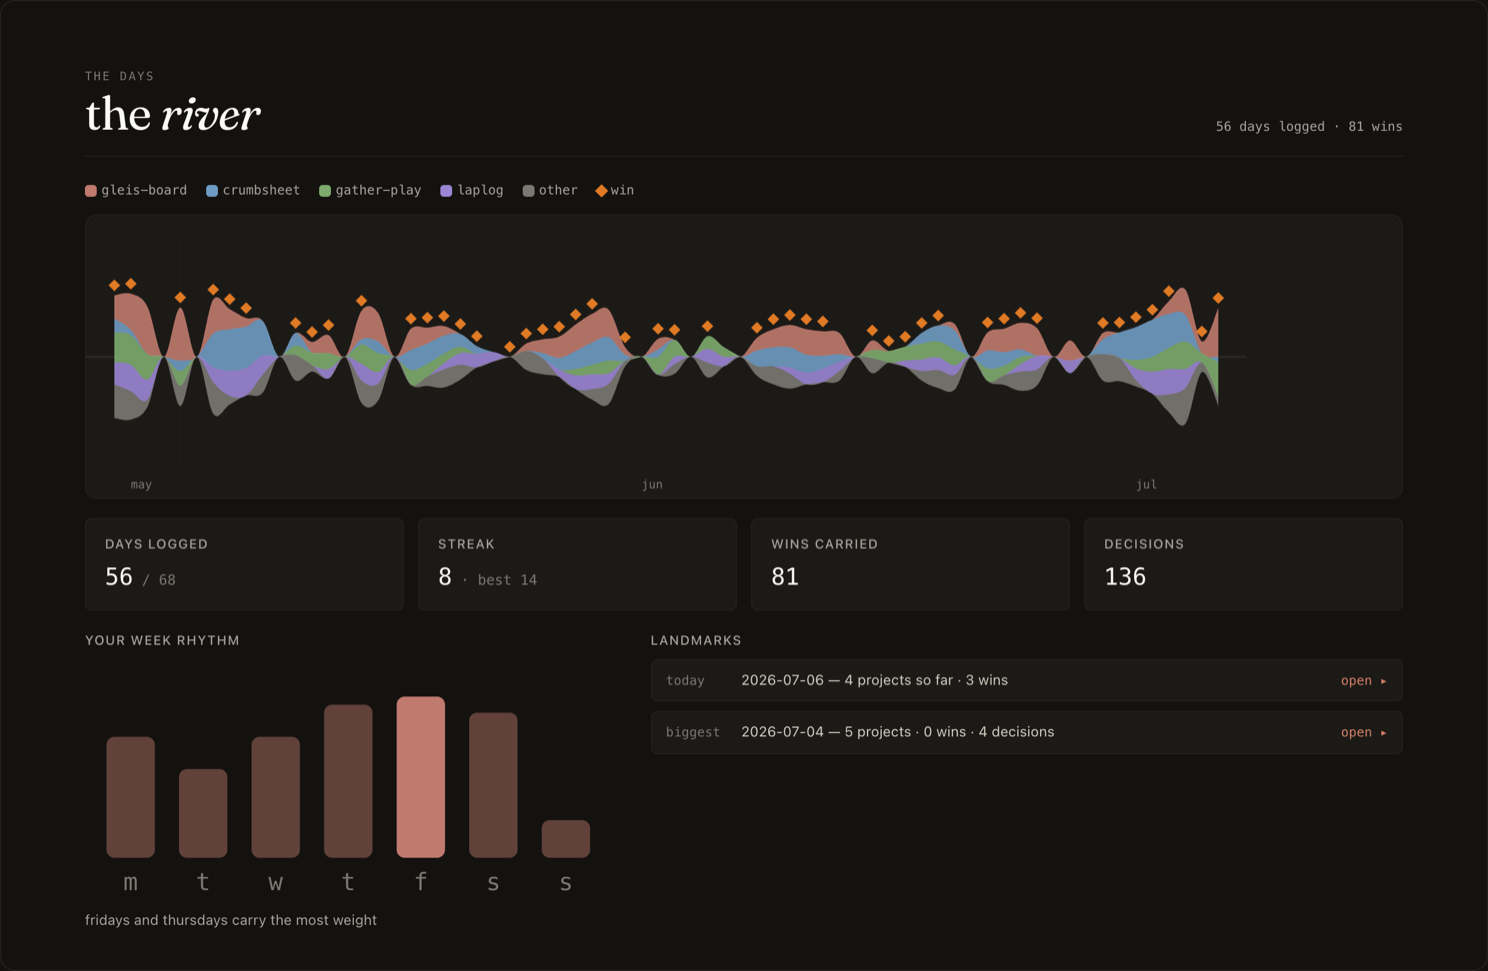
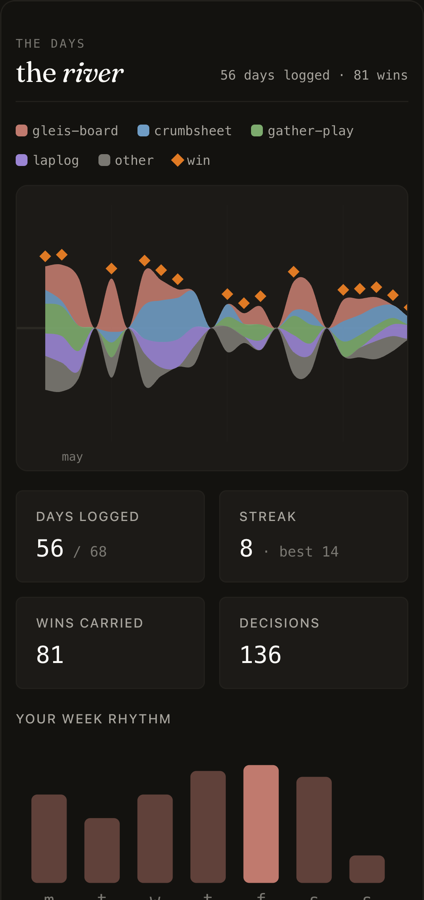
The Days view draws the same journal as a river. One coloured band per project running left to right across the logged window. A stretch I did not log shows up as a hole in the bands, which is the part I actually use it for.
The status board
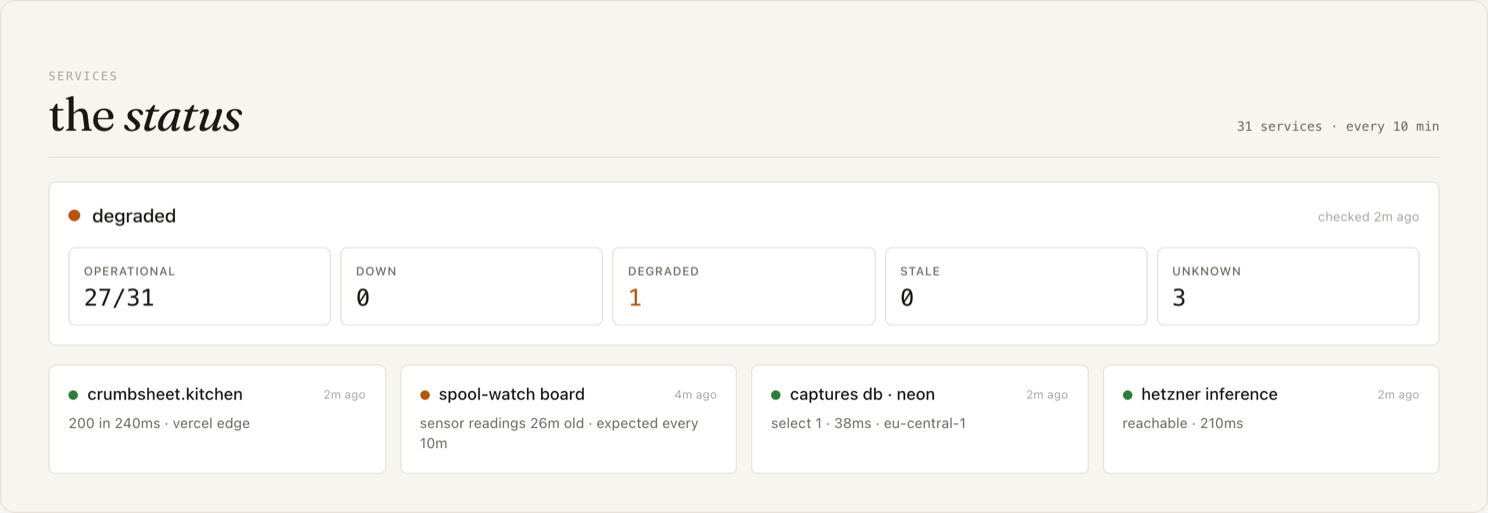
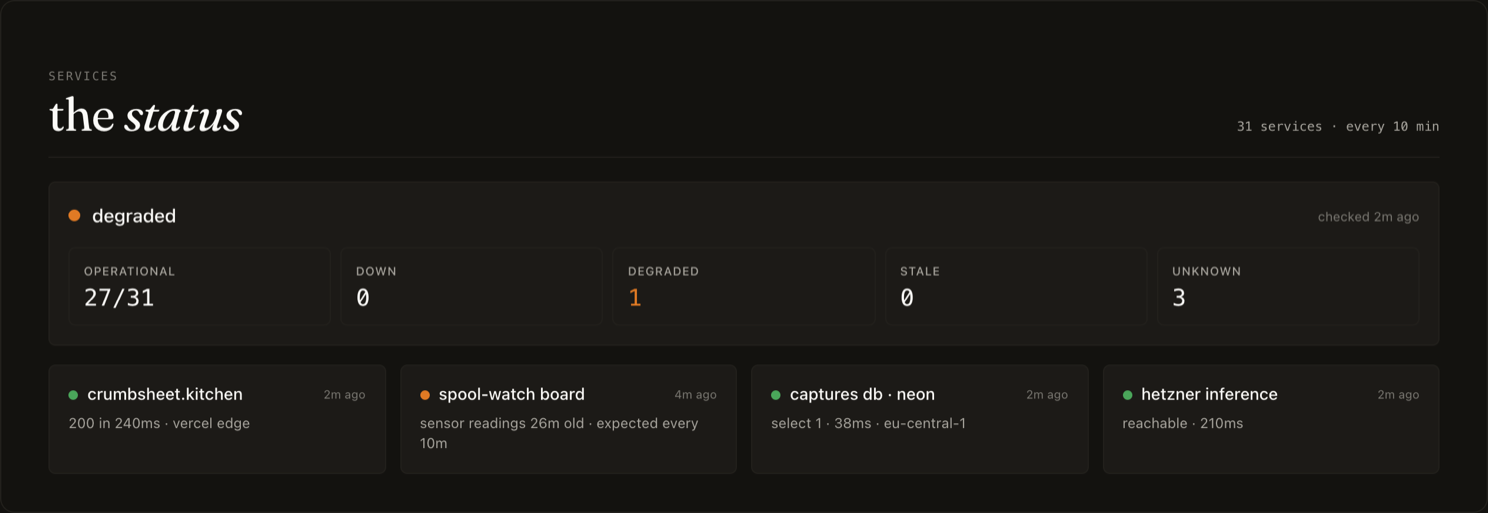
The status board went live on 2 June 2026. It checks my sites, the databases behind them, whether the data is fresh and whether the outside services still respond.
Two rules keep the board honest. Down means checked and failed, and it renders red. Unknown means could not check, and it renders gray.
What the models cost
August was mostly about what the models cost. A flat monthly subscription and a pay-per-use key produce different numbers, so the page splits them.
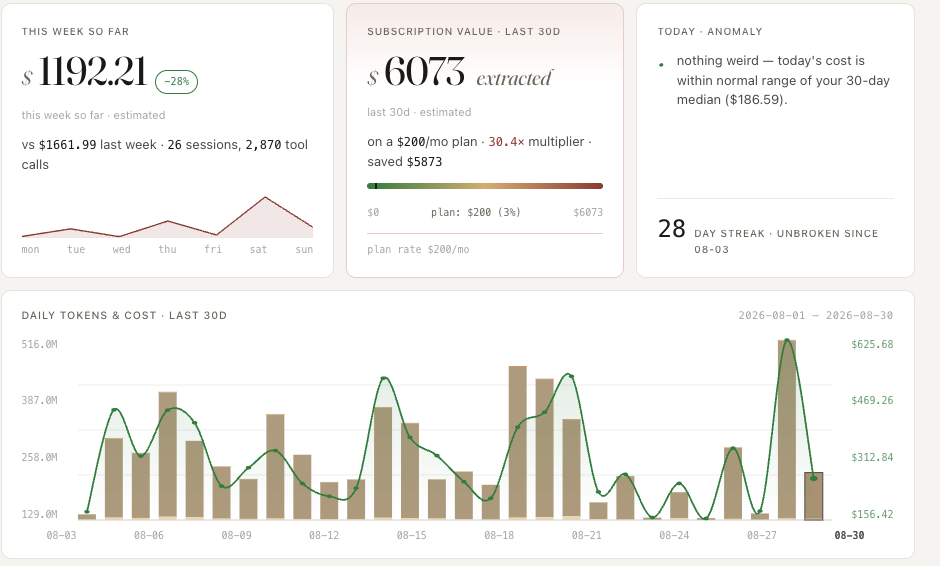
The number the panel leads with is a conversion. It reads $6,073 of pay-as-you-go value extracted over thirty days, against a plan billed at $200 a month. A 30.4 times multiplier. Both figures are true and only one of them ever leaves my account, which is the whole reason the page splits them.
Two leftovers on that page bothered me for a while, a dead spend-trends section and an orphaned quota strip. I deleted both on 15 August. My project note went on listing them as the thing to decide for another eight days, which is a fair demonstration of what this dashboard is for and what it cannot do. It reads the notes. It does not check them.
The 402 day
I wrote the incident up the next day and titled it "Vercel account paused, every site 402, monitor was the cause".
The monitor was easy to convict. It swept every site every hour, and fourteen of the sixteen were hosted on the account paying for the sweep.
Then I measured it, and the logs told a different story. The checking loop was about 5% of it. The rest was tracking data I had pointed at the same app, roughly 7,600 calls a day against the monitor's 384.
The fix was checking three critical hosts often and everything else once a day. Load dropped to 85 requests a day. I stayed on the free plan, because the run rate was a bug and not demand. Vercel granted a one-time courtesy unblock with triple limits for thirty days. Those were set to run out around 19 September 2026. After that, the next breach means paying or nothing.
The capture station
Back on 14 May I designed, built, deployed and flashed a physical capture station for my desk. It is a CYD, a cheap yellow board with a small touchscreen on it.
I picked capture over the other things it could have been, an ambient display or a morning ritual screen. Capture was the one that beat reaching for my phone. A thought gets logged with a physical tap.
Then on 15 May I deleted all of it. Thirty-six files, one day old.
A month later a smaller version came back. On 15 June a 2.4 inch screen on a different board got a read-only view of the same folder. By August 2026 making that display standalone and always-on was still on the goal list. The board had spent the summer on a World Cup live display and then a Düsseldorf weather map instead, which tells you where the goal ranks.
The sign-in page
The sign-in page is the only part anyone else can see. It is a tour through the eleven views the headline promises, every one mocked up with a working layout and invented contents. The projects on it are called gleis-board, crumbsheet, gather-play, desk-critter, spool-watch, laplog, cedar-pulse. None of them exist. The two views it leaves out are the cost pages, so the whole August money story is missing from the public version.
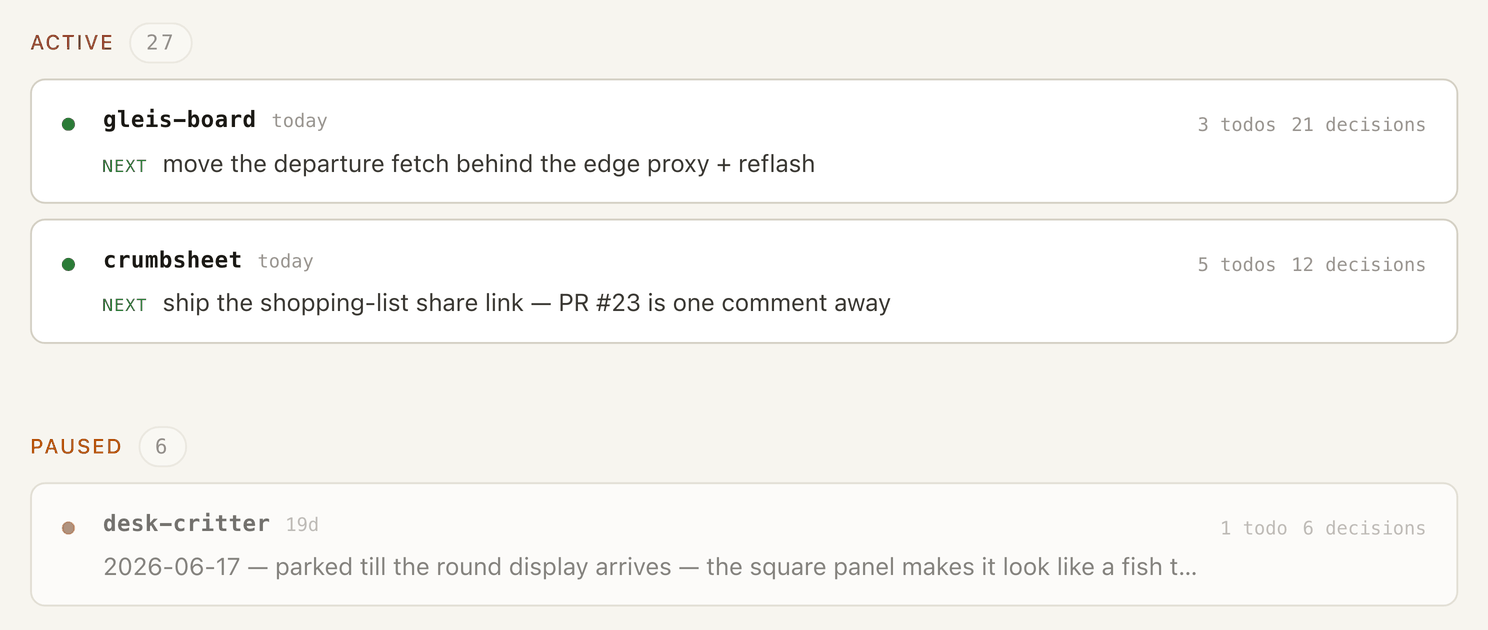
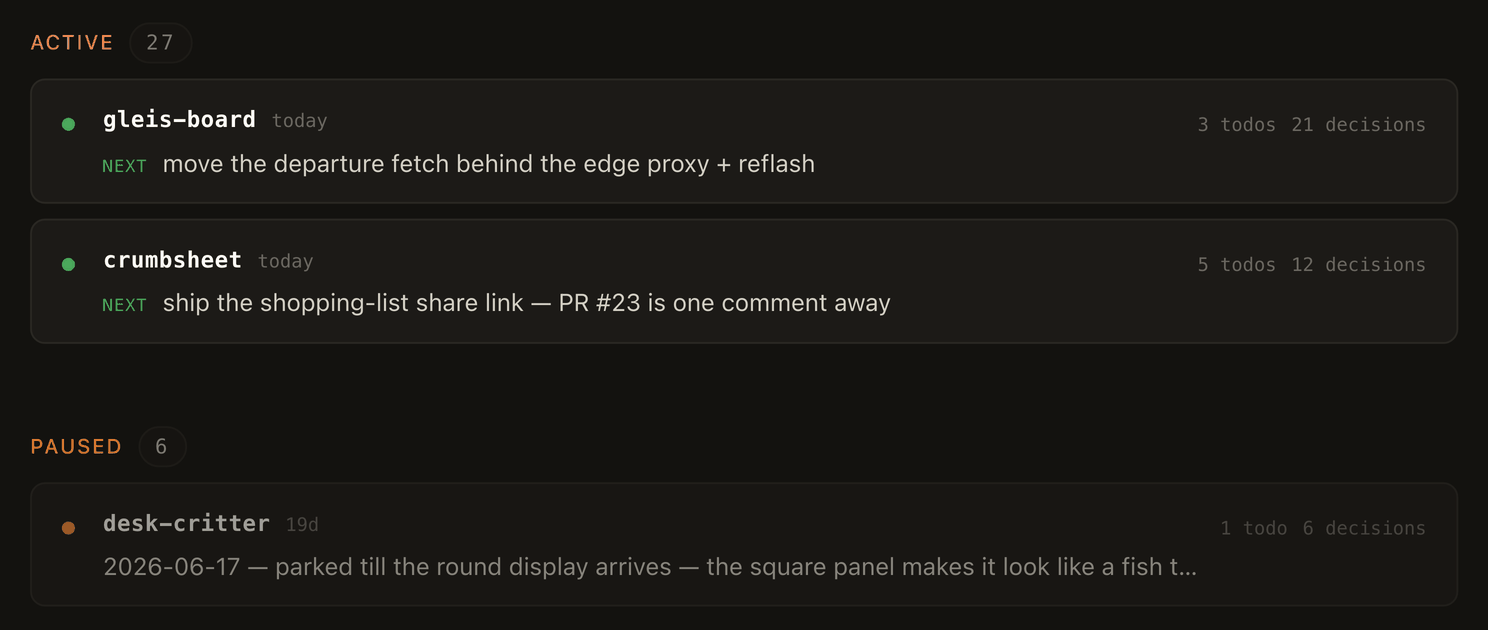
The counts on the same page are real. A band of them sits under the headline.


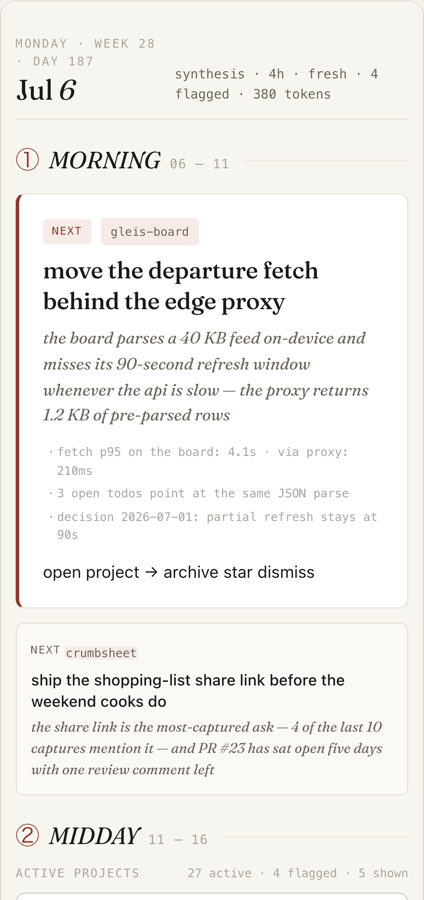
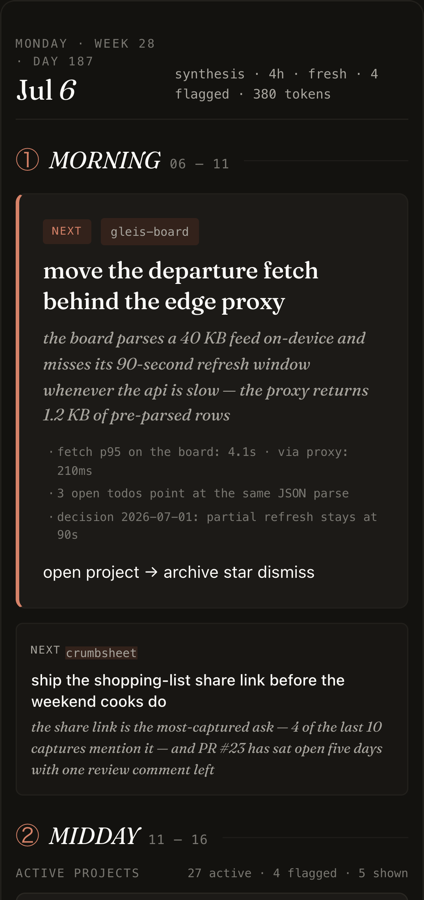
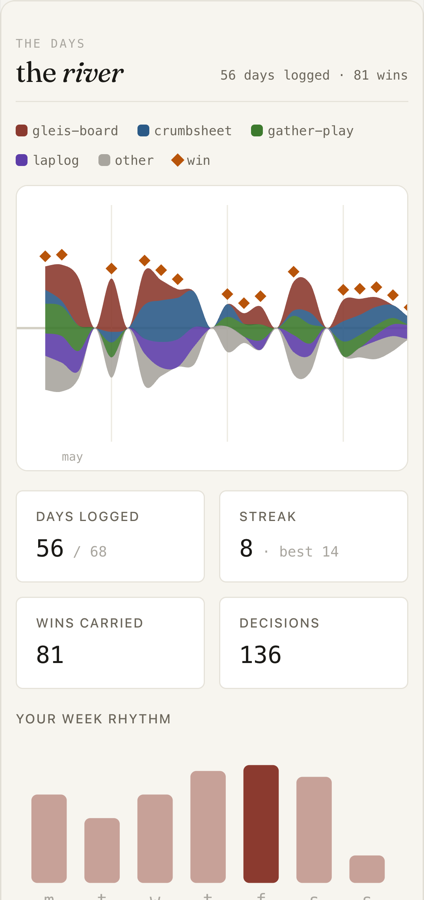
Promotion via true numbers, privacy via fiction. Every count on that page was true the day I measured it, and not one name on it will ever be real.